Harper Simmons · 16 September 2026
Patterns in User Behavior Analysis for Platforms Undergoing Significant Technical Transitions
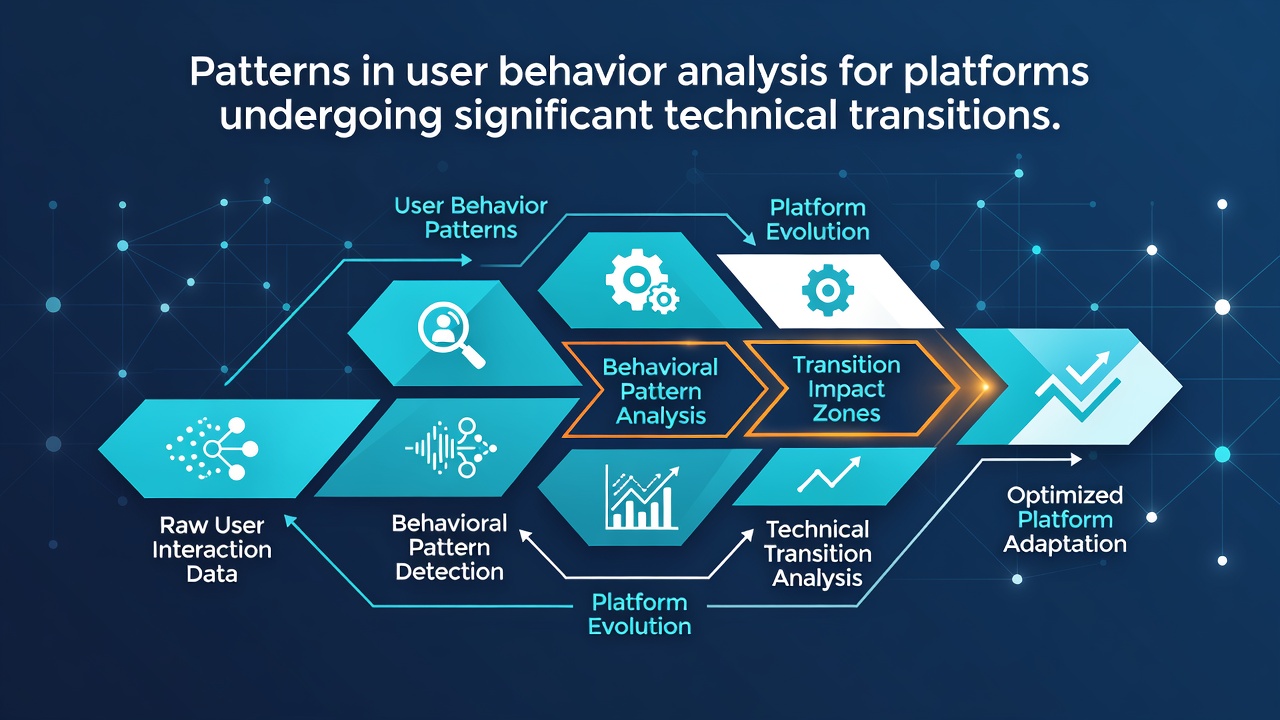
Platforms facing major technical overhauls often see distinct shifts in how users interact with interfaces, complete tasks, and seek support. Researchers track these changes through metrics like session duration, click paths, error rates, and feature adoption curves, and data from multiple studies show consistent trends across industries ranging from enterprise software to consumer apps. Technical transitions typically involve infrastructure upgrades, API migrations, or full system redesigns that alter core functionalities, and observers note that user behavior does not remain static during these periods. Instead patterns emerge in stages beginning with heightened exploration followed by selective engagement or outright avoidance of updated sections.Initial Response Phase and Navigation Adjustments
Users frequently increase their time spent on help documentation and support channels in the first days after a transition goes live, according to reports compiled by research teams at various institutions. Session logs reveal longer dwell times on error pages and repeated attempts at familiar workflows that no longer function identically, while clickstream data indicates users test alternative routes through menus and search functions before settling into new habits.
Studies conducted on enterprise platforms after cloud migrations found that mobile users exhibit sharper declines in task completion rates compared with desktop users during the opening weeks, and this gap narrows only after additional interface tweaks address touch-target inconsistencies. Analysts attribute the difference to variations in how each device type surfaces confirmation dialogs and loading indicators following backend changes.
Engagement Metrics Across User Segments
Segmented analysis shows power users often adapt faster than casual visitors, yet both groups display temporary spikes in multi-tab browsing as individuals compare old and new layouts side by side. Data from longitudinal tracking projects indicate that return visit frequency drops by measurable percentages in the immediate aftermath of updates, then rebounds once users confirm core features remain available even if their placement shifts.
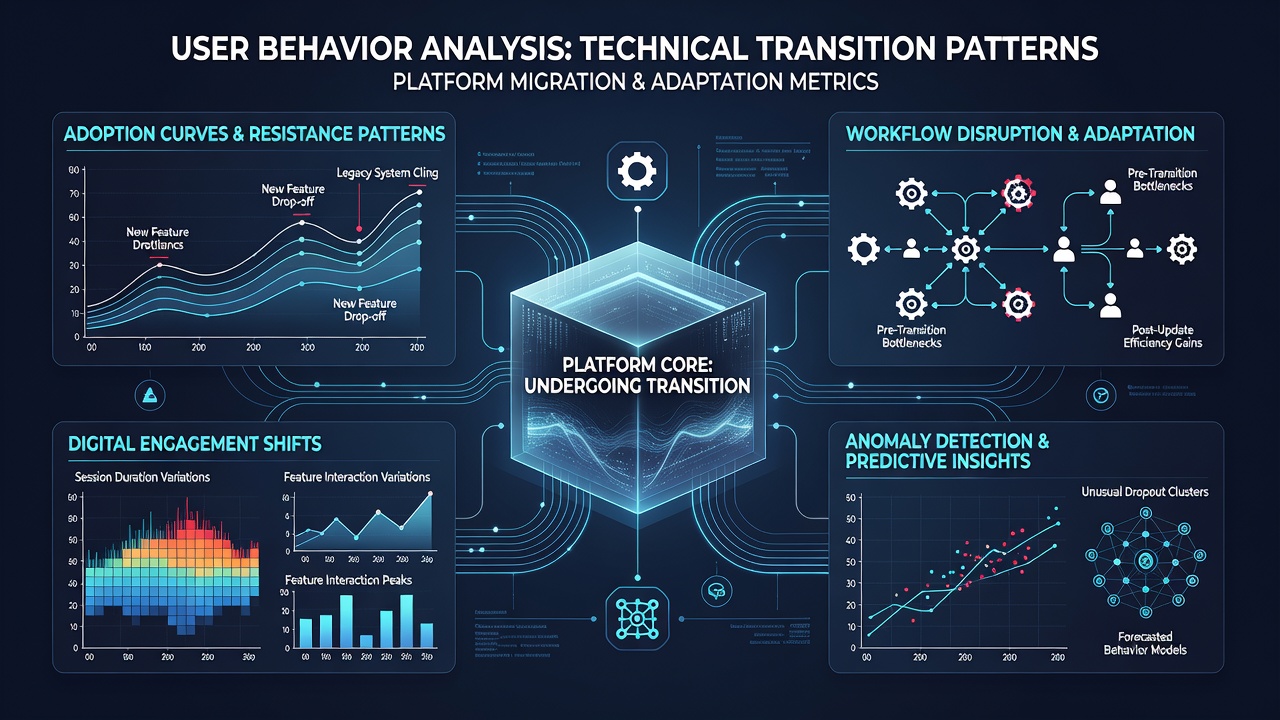
European Commission digital economy reports highlight how regulatory compliance updates, such as consent banner revisions, produce distinct behavioral clusters where certain demographics grant permissions at higher rates while others repeatedly dismiss prompts. These clusters correlate with geographic and age-based variables tracked across member states, providing platforms with granular signals for targeted communication strategies.
Support Ticket Patterns and Feedback Loops
Support ticket volumes rise predictably within 48 hours of deployment, and ticket categorization data reveals that navigation-related queries outnumber functionality complaints during early stages. Later in the transition cycle, the balance shifts toward requests for advanced feature explanations as users move beyond basic access issues.
One study from a Canadian research consortium examined several SaaS platforms that completed major version upgrades in 2024 and 2025, and the findings showed that users who received in-app guided tours completed onboarding sequences at rates 30 percent higher than those relying solely on static documentation. Platforms that delayed these tours until after initial complaints accumulated experienced prolonged recovery periods in overall engagement scores.
Anticipated Developments Around September 2026
Industry observers expect additional datasets to surface in September 2026 from ongoing academic collaborations that track multi-year platform evolutions, and preliminary indicators suggest increased use of predictive modeling to forecast behavior changes before they occur. These models incorporate variables such as prior session history, device type, and regional network conditions to flag accounts likely to disengage during upcoming infrastructure events.
Australian government digital transformation summaries released in prior years already demonstrate how public sector platforms mitigated similar risks through phased rollouts that allowed parallel access to legacy and updated environments, and comparable approaches appear in private sector case studies now under review.
Conclusion
Technical transitions generate measurable, repeatable patterns in user behavior that platforms can monitor through established analytics frameworks, and organizations that integrate real-time segmentation with proactive interface adjustments tend to observe faster stabilization of key metrics. Continued collection of cross-industry data will refine these understanding further as new transition cycles unfold.